blog
For Marketers: How to Measure Digital Engagement
Estimated Reading Time: 7 minutes
Marketers have been collecting data on their digital marketing initiatives ever since the web became a mainstream marketing platform. The vast majority of this kind of “analytics” relates to user actions and behavior (i.e. “What path did a specific user take on my website,” or “What are the most commonly clicked links on this page?”, etc.). When marketing applications became more ubiquitous, these same kinds of data collection principles were similarly used in an attempt to measure the effectiveness of these applications.
Particularly for marketing apps (be they web apps or native apps on desktop or mobile devices) the key question marketers should be asking about their apps is: “Are my users engaged?” What insightful marketers recently have learned is that just looking at clicks and time-on-page is not sufficient to develop an understanding of the user’s intent, and neither are these kinds of declarative metrics reliable indications or predictors of future behavior.
What is digital customer engagement?
“Engagement” is a metric that some marketers have started to use in the context of web analytics. If we look at the definition of engagement in Google Analytics documentation, they define it as:
Any user interaction with your site or app.
This is a peculiar choice, which doesn’t jibe with what people generally mean by the word engagement. The dictionary definition of the word engage is a useful reference:
Occupy, attract, or involve (someone’s interest or attention).
Why the disconnect between the analytics definition and the dictionary definition? Because analytics software is limited to the range of data that was collected, and web analytics typically only counts “hits” on pages or clicks. This limitation has repercussions that turn a lot of web analytics metrics into a wasteland of misleading, useless data.
For example, suppose your prospect searches for information about your product. They click through the search link and end up on a product page. Your product page is well-designed, and the user spends several minutes reading about your product. They then close that browser window. This was an “engagement” lasting several minutes. However, web analytics saw only one hit and then nothing else. As far as web analytics are concerned, it could easily be counted as a zero-interaction “bounce.”
The opposite also happens. Suppose your prospect starts on your website. They browse to a page about a product and get distracted by a Facebook notification on their phone. A few minutes later, they return to your product page in their browser, decide they clicked on the wrong product, and navigate to your home page. Web analytics software will report a several-minute engagement, while there was no engagement at all on the part of the user.
How do you measure digital engagement?
Instead of accepting this status quo, what if we designed a strategy measuring digital engagement by making the app itself an active participant in the analysis? How different would the results be?
Let’s start with these basic digital engagement definitions:
#1 – A session is a series of interactions between the user and the application.
#2 – A single session can span multiple short bursts of activity.
#3 – Multi-tasking is a reality, and apps going in and out of the foreground only marks a session boundary if that the idle time is large (say, for example, a half-hour).
#4 – Idle time should be disregarded. The app can monitor input like mouse-cursor motion, scrolling and clicks/taps to determine whether the app is idle.
#5 – Sessions could happen online or offline. In the offline case, data should be collected and accurately reported at a later time when the app is used online.
If we use these definitions/rules, both the examples above would much better answer the question: “Is my user engaged?” In the first case (reading everything on a single page), the session would last several minutes. In the second case (the Facebook distraction), after subtracting out idle time, the session only would last a few seconds.
Google Analytics vs. Actual Engagement
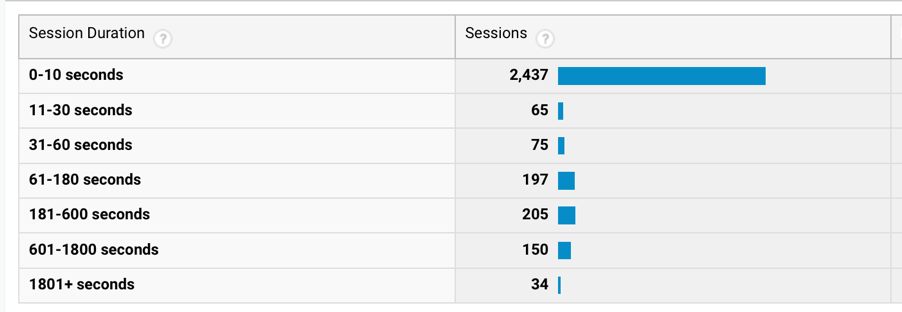
When you compare traditional web analytics to analytics collected using these specifications, the difference is striking. Looking at two weeks of data from one of Kaon Interactive’s marketing and sales applications that gathers analytics both in Google Analytics and using this new method, Google Analytics reports 3,163 sessions:
When, in fact there were 4,926 sessions (55% more than Google Analytics reported!) with a completely different distribution:
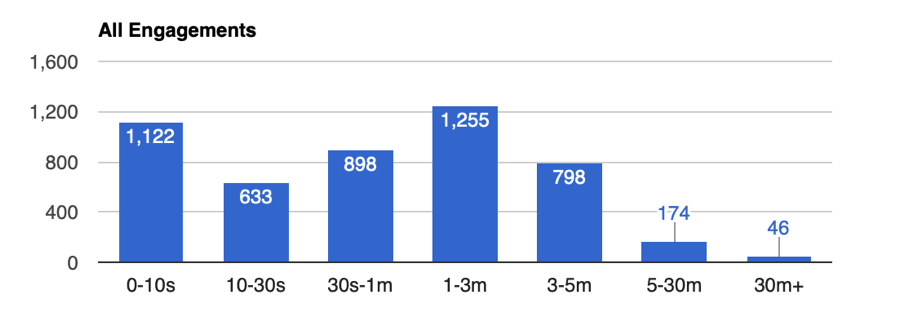
Why do they look so different, if they were analyzing the same user sessions? The difference in the distribution of engagement durations is easily explained. This app is highly engaging (it consists mostly of 3D, interactive, product tours). Users can spend many minutes exploring products and features without changing pages, and, so, they get bucketed as one-hit “bounces,” despite being minutes-long engagements.
The difference in the count of sessions is harder to explain, since Google Analytics uses the same “half-hour idle” rule we used here. The most likely explanation is that Google Analytics doesn’t include some of the sessions that only visited a single page. Another possibility is that the web analytics stores a statistical model of sessions, not the individual sessions at all – and then attempts to reconstruct/estimate raw numbers from those models. That’s not a problem when you are looking at trends, since, over time, the models will tend to have similar error. But, it can be confusing and significantly misleading if you are trying to use this “web analytics” data to make marketing decisions (such as understanding conversions to sales or campaign clicks to attribute sales/revenue to particular marketing initiatives/tools).
This particular app is deployed a variety of ways, which leads to different engagement distributions (colors indicate different device types):
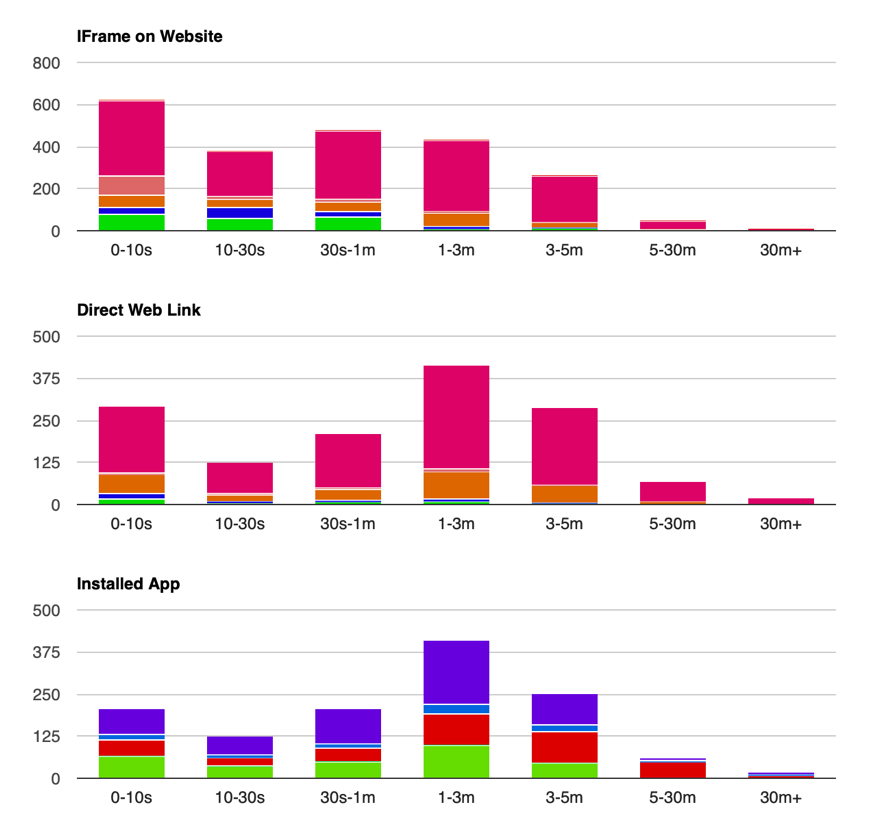
About half the usage of this app is on the company’s website, with individual 3D, interactive, product tours available either on the main product page or on a dedicated 3D product sub-page. A quarter of the views are from people going to a direct link (possibly from the corporate site or shared directly). The last quarter are from the sales team that have this app installed on their phones, tablets and computers. Understanding the engagement profile of the sales team separately from understanding customer or prospect engagement is critical for developing accurate and meaningful marketing insights.
In the case of web embedding, the user is not as likely to be there just to see the specific app content, which explains the bias in the distribution toward slightly lower levels of engagement. It is noteworthy that, even in this case, there are significant proportions of sessions lasting more than three minutes. (For comparison purposes, industry averages for time-on-page range from 40 seconds to two minutes.) Keep in mind that idle time is subtracted out, so this is only counting time interacting with the app content.
It is possible to record events other than page views to web analytics software. This might make web analytics software better able to capture true engagement, since a user of a modern website could be interacting quite a bit without changing pages. For example, another Kaon-developed app fits that profile. Although the user never changes “pages,” we record events each time they click to learn more about a particular part of the solution story being told.
For a single period in this app, Google Analytics reported 31 sessions:
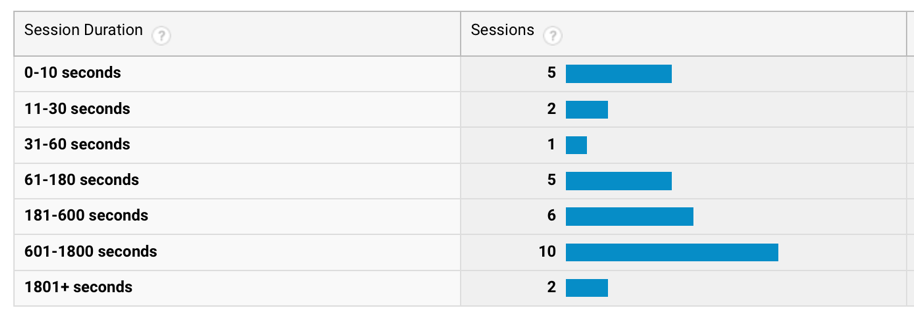
This closely matches the 29 sessions counted by our analytics (the difference could be explained by slightly different definition of when a “day” starts). However, the distribution reported by Google Analytics still shows considerable error. Here is the actual distribution of session engagement:
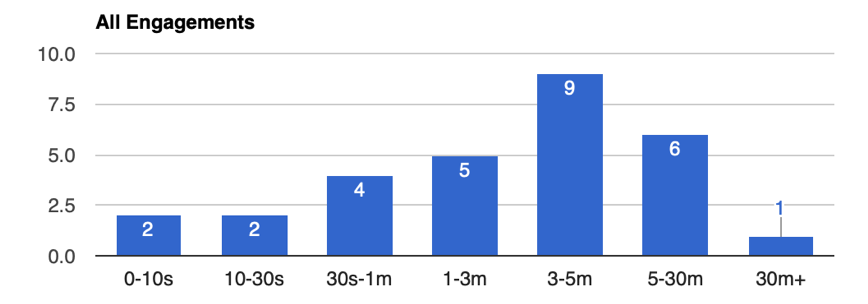
The difference between these distributions demonstrates flaws in traditional web analytics engagement measures, even though the pages are highly instrumented. Web analytics overstates the number of short sessions, because a user might be engaged (scrolling or moving the mouse) without clicking on anything. It also overstates the number of long sessions because it fails to subtract out idle time. App and website users multitask constantly, and marketers are kidding themselves if they believe “time-on-page” is anything like a measure of actual engagement.
To clearly illustrate the discrepancies in Google Analytics, we looked at a large-scale virtual event hosted by one of our customers using a custom-built interactive application in both Google Analytics and the application’s back-end insights portal.
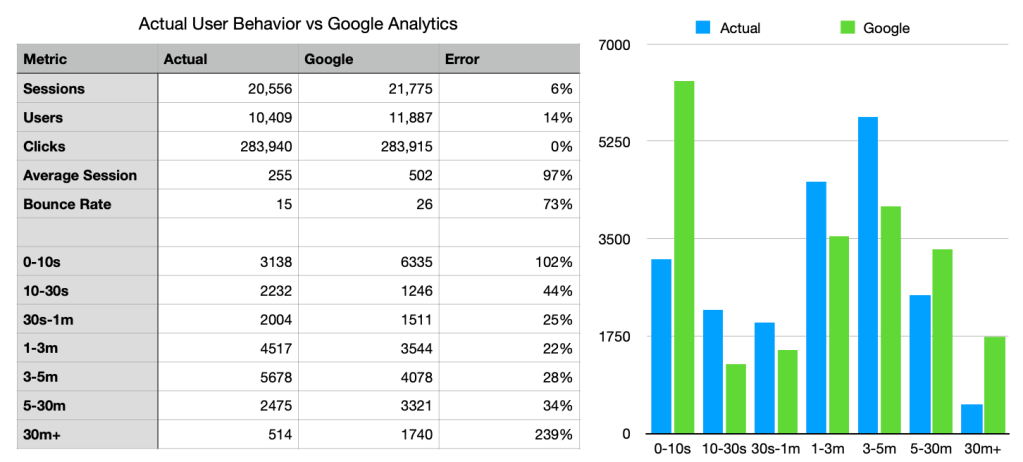
Generally, you can see that Google overestimated the number of attendees but underestimated their true engagement — especially in that critical 3-5-minute engagement time range.
Metrics for digital customer engagement
Of course, we aren’t measuring digital engagement for its own sake. We want to know engagement because we believe that it predicts other things. In an app, engagement should predict specific marketing value propositions, such as understanding competitive differentiation, customer satisfaction, or long-term value of the app in helping to solve problems or illustrate solutions. On an e-commerce website, engagement should predict conversion outcomes. Since web analytics software is unable to accurately report customer engagement, marketers would be wise to stop looking at the reported digital engagement metrics and find other ways to measure the effectiveness of the app or website in meeting its goals.
The other alternative is to do what Kaon has done and add active digital engagement metrics to the app or website and develop a scalable back-end system to store and report this data. If the past is any indication, it is unlikely that web analytics providers will add true engagement measurement to their platforms any time soon.
